Tags Fire in GTM But Nothing Reaches GA4? Fix Your Transmission Layer
Your GTM tags fire perfectly in Preview Mode, but GA4 shows no data. This is Layer 3 (Transmission) failure—where data gets lost between your browser and Google's servers. Here's how to diagnose and fix it.
Quick Navigation
The “Everything Looks Fine” Problem That Cost $300K
An enterprise client called me in a panic. Their GTM setup was “perfect” according to their agency:
- ✅ GTM container loading correctly
- ✅ All tags firing in Preview Mode
- ✅ Variables resolving expected values
- ✅ No errors in the console
But their GA4 property was empty. Zero events. Zero users. Complete radio silence.
They’d spent three weeks troubleshooting Layers 1 and 2 (Infrastructure and Implementation). The agency rebuilt the entire GTM container from scratch. Nothing changed.
The problem wasn’t in GTM—it was in transmission.
The diagnostic took 90 seconds. The fix took 2 hours. The cost of three weeks without data: $300K in ad spend optimized to phantom metrics because their attribution model was running on stale data.
This is Layer 3 failure: the HTTP requests from your browser to Google’s collection servers are failing, blocked, or malformed.
What Layer 3 (Transmission) Actually Means
Layer 3 is the handoff zone between GTM and GA4. This is where GTM stops and Google Analytics begins.
The transmission path:
- Your GA4 tag fires in GTM (Layer 2 ✅)
- GTM calls the
gtag.jslibrary gtag.jsconstructs an HTTP request with your event data- Browser sends request to
https://www.google-analytics.com/g/collect - Google’s collection server responds with
204 No Content
If this chain breaks anywhere, your data never reaches GA4.
Layer 3 covers:
gtag.jslibrary loading and executing- HTTP requests being sent from the browser
- Requests successfully reaching Google’s servers
- Server-side GTM (sGTM) relay if configured
- Ad blockers and privacy tools intercepting requests
- Consent mode blocking transmission
- Network infrastructure (firewalls, proxies) allowing requests
This is the most frustrating layer to debug because everything looks fine in GTM. Tags fire. Variables work. Preview Mode shows green checkmarks.
But no data reaches GA4.
The Transmission Diagnostic (90 Seconds to $300K Root Cause)
Step 1: Are Requests Being Sent?
Open Chrome DevTools → Network tab. Filter for “collect” or “analytics.”
Reload your page. Trigger a conversion event. Look for requests to:
https://www.google-analytics.com/g/collect- Or (if using sGTM):
https://your-sgtm-domain.com/g/collect
What you should see:
| Status | What It Means |
|---|---|
| 204 No Content | ✅ Success - Google received your data |
| 200 OK | ✅ Success (alternative response) |
| 0 (cancelled) | ❌ Request blocked by ad blocker or CSP |
| 403 Forbidden | ❌ Request blocked by server policy |
| 404 Not Found | ❌ Wrong endpoint (sGTM misconfigured) |
| (failed) net::ERR_BLOCKED_BY_CLIENT | ❌ Browser extension blocking |
| No requests at all | ❌ gtag.js didn’t load or consent blocked |
In that $300K case, the Network tab showed:
0 (cancelled) - net::ERR_BLOCKED_BY_CLIENT
Not a GTM problem. Not a tag configuration problem. The corporate firewall was blocking all requests to google-analytics.com.
Their IT department had implemented new security policies three weeks prior (exactly when tracking stopped). The agency never checked the Network tab—they assumed it was a GTM configuration issue.
Step 2: Monitor Requests in Real-Time
Paste this diagnostic snippet in your console:
(() => {
  const observer = new PerformanceObserver((list) => {
    list.getEntries().forEach((entry) => {
      if (entry.name.includes('/g/collect')) {
        console.log(`🌐 GA4 Request: ${entry.responseStatus || 'pending'} - ${entry.name.split('?')[0]}`);
      }
    });
  });
  observer.observe({entryTypes: ['resource']});
  return 'Monitoring GA4 requests - check console';
})();
Now interact with your site (click buttons, submit forms, trigger events). This snippet logs every GA4 request attempt in real-time.
What good looks like:
🌐 GA4 Request: 204 - https://www.google-analytics.com/g/collect
🌐 GA4 Request: 204 - https://www.google-analytics.com/g/collect
Red flags:
(No output at all) → No requests being sent
🌐 GA4 Request: 0 - https://www.google-analytics.com/g/collect → Blocked
🌐 GA4 Request: pending - https://your-sgtm.com/g/collect → sGTM timeout
Step 3: Parse the Last Request (Advanced)
If requests ARE being sent but data still doesn’t appear in GA4, check what’s in the request:
(() => {
  const entries = performance.getEntriesByType('resource');
  const ga4 = entries.filter(e => e.name.includes('/g/collect'));
  if (ga4.length === 0) return 'No GA4 requests found';
  const last = ga4[ga4.length - 1];
  const url = new URL(last.name);
  const params = Object.fromEntries(url.searchParams);
  return {
    event: params.en || params.t,
    measurement_id: params.tid,
    client_id: params.cid,
    session_id: params.sid,
    currency: params.cu,
    value: params.tr || params.ev
  };
})();
This shows you what data is actually being sent to Google.
What to verify:
measurement_idmatches your GA4 property (G-XXXXXXXXXX)client_idexists (GA4 needs this to identify users)eventname matches what you expect- Required parameters are present (e.g.,
valuefor purchase events)
If measurement_id is wrong or missing, your GA4 Configuration Tag in GTM is misconfigured. This is technically a Layer 2 issue, but it manifests as a transmission failure.
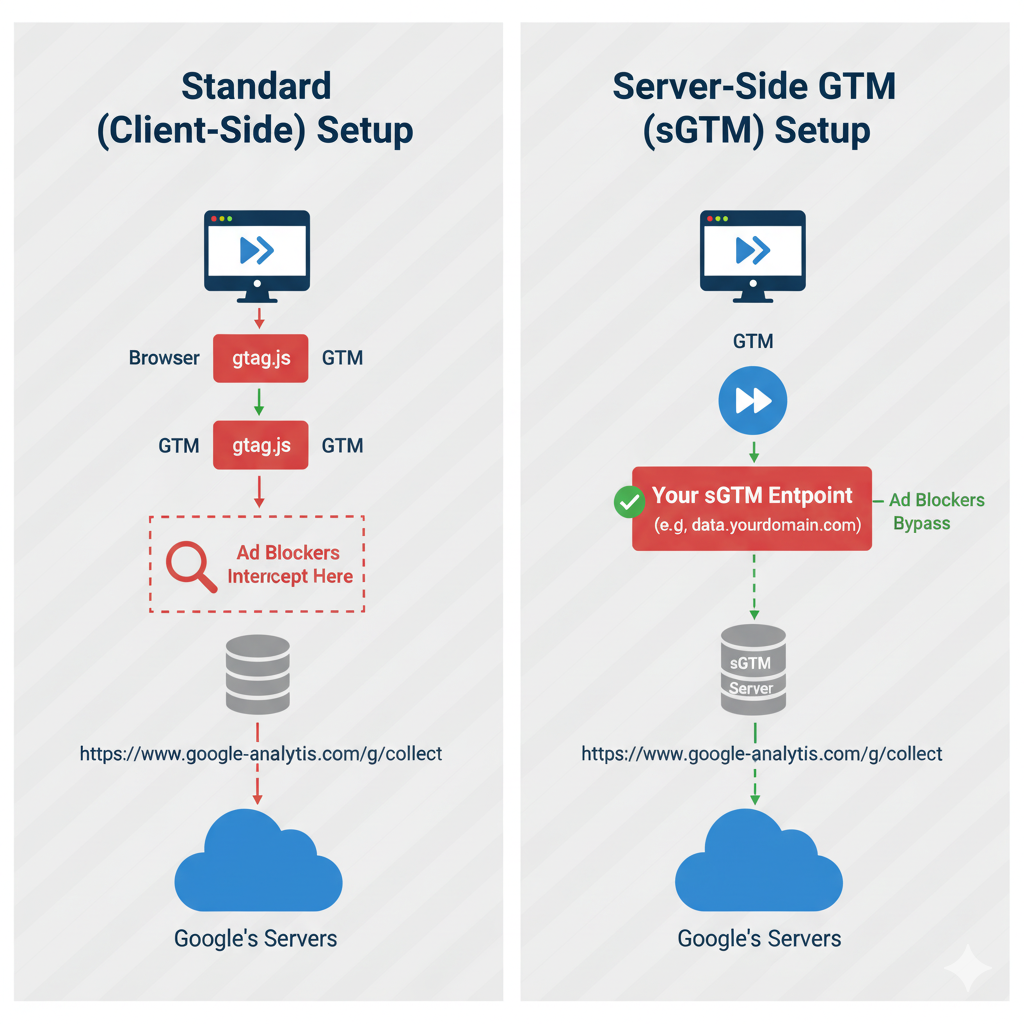
The EXIT POINT: Where GTM Hands Off to GA4
Understanding the exit point is critical for Layer 3 diagnostics.
Standard (Client-Side) Setup:
Browser → GTM → gtag.js → https://www.google-analytics.com/g/collect → Google's servers
Server-Side GTM (sGTM) Setup:
Browser → GTM → Your sGTM endpoint → Google's servers
The exit point is where you lose visibility into what’s happening.
In client-side setups:
- You can see the request in the Network tab
- You can see the response status (204 = success)
- You can inspect the payload
In sGTM setups:
- You see the request to YOUR domain
- You DON’T see the relay from your server to Google
- If your server’s relay is broken, browser diagnostics look fine
This is why sGTM troubleshooting requires server-side logging, not just browser DevTools.
The Three Most Common Transmission Failures
1. Ad Blockers and Privacy Extensions
Symptom: Requests to google-analytics.com show status 0 (cancelled) or net::ERR_BLOCKED_BY_CLIENT
What’s happening: Browser extensions (uBlock Origin, Privacy Badger, Brave Shields) are blocking GA4 requests.
The reality:
- 30-40% of internet users run ad blockers
- Brave browser blocks GA4 by default
- Firefox Enhanced Tracking Protection blocks GA4
- Safari ITP heavily restricts GA4 cookies
The diagnostic:
- Open your site in an incognito window with extensions disabled
- Check Network tab for
collectrequests - If they work in incognito but not in normal browsing → ad blocker
The business reality: You can’t “fix” this. You can only measure it and account for it.
The mitigation: Server-side GTM (sGTM) bypasses most ad blockers because the request goes to YOUR domain, not Google’s. Ad blockers don’t know to block your-domain.com/g/collect.
Business impact: One e-commerce client assumed they had 10,000 visitors/day. After implementing sGTM, they discovered they actually had 15,000—40% were blocked by ad blockers previously.
2. Consent Mode Blocking Transmission
Symptom: GTM loads, tags fire in Preview Mode, but no requests appear in Network tab.
What’s happening: Google Consent Mode v2 is blocking tag execution until consent is granted.
How Consent Mode works:
- User lands on your site
- Consent banner appears
- Until user clicks “Accept,” GA4 tags are in “denied” state
- GTM fires tags, but they send NO data (just “ping” events)
- Only after consent do full events transmit
The diagnostic:
- Load your page
- Don’t click the consent banner
- Check Network tab for
/g/collectrequests - You’ll see requests, but they’re minimal (no user data)
In GA4 DebugView:
- Events appear as
first_visitorsession_start - But user properties and detailed parameters are missing
- Events are marked as “consent denied”
The fix: This isn’t broken—it’s working as intended. But if your consent banner isn’t working correctly (users never grant consent), you’ll have no usable data.
Business impact: I’ve seen sites where 80% of users never interact with the consent banner (they just close it or ignore it). Those users never get tracked. The business thinks they have low traffic—actually, they have low consent rates.
3. Server-Side GTM (sGTM) Misconfiguration
Symptom: Browser shows successful request to your sGTM endpoint, but GA4 receives no data.
What’s happening: The browser → sGTM request succeeds, but the sGTM → Google relay fails.
Common sGTM failure modes:
| Problem | Symptom | Fix |
|---|---|---|
| Measurement ID not mapped | sGTM receives events but doesn’t know where to send them | Configure GA4 client in sGTM with correct Measurement ID |
| Server timing out | Browser request times out after 30 seconds | Scale up sGTM server resources |
| Firewall blocking outbound | sGTM can’t reach google-analytics.com | Whitelist Google IPs in your server’s firewall |
| Missing event parameters | sGTM strips parameters during transformation | Review Tag templates in sGTM |
The diagnostic (requires server access):
- SSH into your sGTM server
- Check server logs for outbound requests to
google-analytics.com - Look for 204 responses (success) or errors
If you don’t have server access, you can use GA4 DebugView as a proxy:
- Send a test event from your browser
- Wait 10 seconds
- Check DebugView for the event
- If it doesn’t appear, sGTM → Google relay is broken
Business impact: One client spent $15K setting up sGTM. Their agency configured the browser → sGTM connection perfectly but never tested the sGTM → Google relay. They had zero data for two months before realizing.
When Ad Blockers Are Your Biggest Problem
Let’s address the elephant in the room: 30-40% of your traffic is probably blocking GA4 right now.
This isn’t a bug. This isn’t something you can “fix” in GTM. It’s a fundamental limitation of client-side analytics.
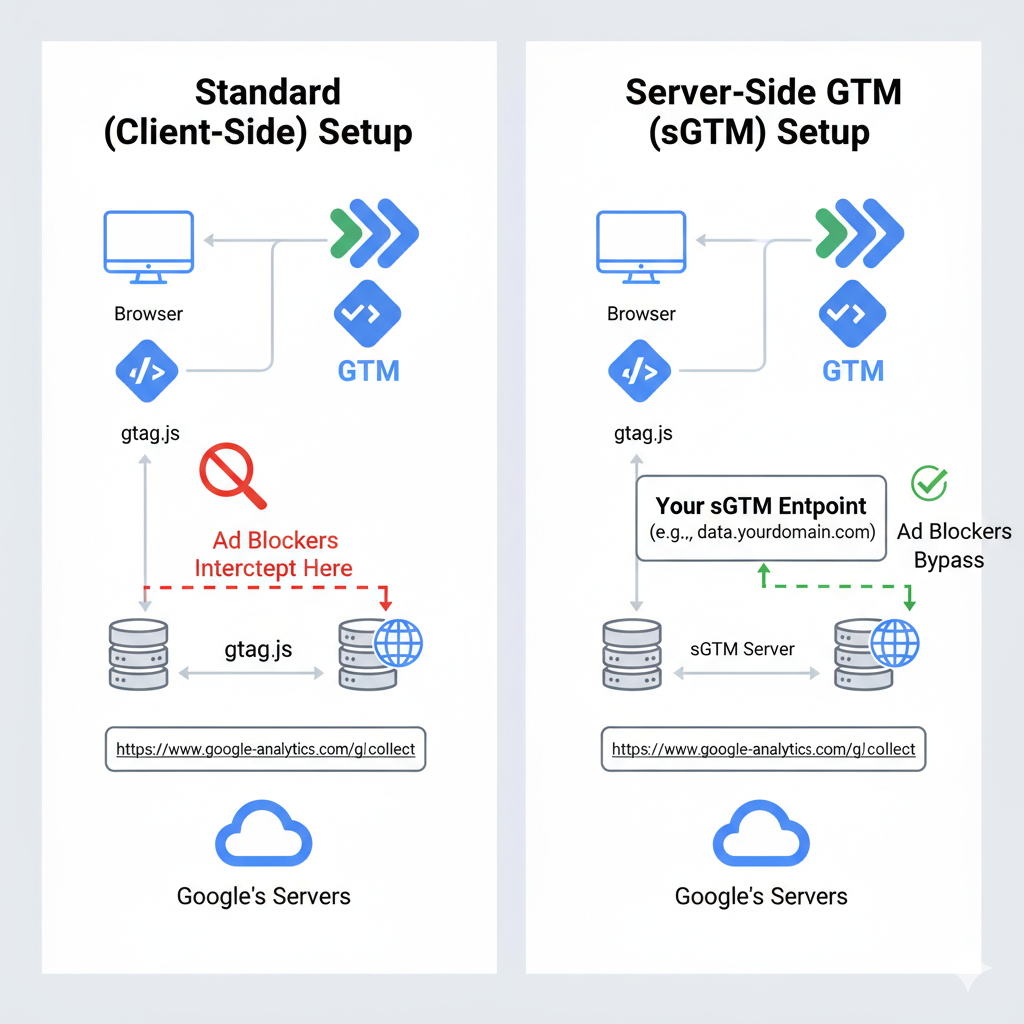 Standard client-side setup: Ad blockers intercept requests to google-analytics.com. Server-side GTM: Requests go to your domain, bypassing most ad blockers.
Your options:
Option 1: Accept the loss
- Simplest approach
- Assume your GA4 data represents 60-70% of actual traffic
- Use directional metrics, not absolute counts
- Risk: If ad blocker adoption grows, your blind spot grows
Option 2: Implement server-side GTM (sGTM)
- Bypasses most ad blockers (requests go to your domain)
- Requires server infrastructure ($50-200/month)
- Requires technical setup (4-8 hours for first implementation)
- Benefit: Captures 90-95% of traffic instead of 60-70%
Option 3: Use server-side analytics entirely
- Skip browser-based tracking
- Log events on your backend
- Send to GA4 via Measurement Protocol
- Benefit: 100% coverage, no ad blockers
- Tradeoff: Requires significant development work
Business reality check: If you’re spending $50K+/month on ads, losing 40% of attribution data costs more than implementing sGTM.
If you’re a small business spending $2K/month, accepting the loss is often the pragmatic choice.
The Network Tab Workflow (The Right Way)
Most people open the Network tab, see hundreds of requests, and panic. Here’s the systematic approach:
Step 1: Filter for Analytics Requests Only
In the Network tab filter box, type: collect
This narrows down to GA4 requests only. Ignore everything else.
Step 2: Clear and Reload
Click the 🚫 icon to clear the Network tab. Reload the page. Now you’re seeing ONLY post-load requests.
Step 3: Trigger Your Critical Events
Don’t just load the page. Actually interact:
- Click your main CTA button
- Submit a form
- Complete a purchase
- Watch for corresponding
collectrequests
Step 4: For Each Request, Check Three Things
- Status: 204 or 200 = good. Anything else = problem.
- Type: Should be
pingorfetch - Timing: Should complete in <500ms
Step 5: Inspect the Request Payload
Click on a collect request → “Payload” tab → “Query String Parameters”
Verify:
tid= your GA4 Measurement IDen= the event name you expectcid= client ID exists- Event-specific parameters (e.g.,
trfor transaction value)
If any of these are missing or wrong, you have a Layer 2 (Implementation) problem, not Layer 3.
The Transmission Checklist
Before escalating to GA4 support or blaming your tracking setup:
Run this checklist:
- ✅ Open Network tab → Filter for “collect” → Do requests appear?
- ✅ Check request status → 204 or 200?
- ✅ Test in incognito (no extensions) → Does behavior change?
- ✅ Check consent banner → Did you grant consent?
- ✅ Verify Measurement ID in request payload → Matches your GA4 property?
- ✅ If using sGTM → Check server logs for relay to Google
If all six pass but data still doesn’t appear in GA4, move to Layer 4 (Processing) diagnostics.
If any fail, you’ve found your transmission failure.
What This Means for Your Business
Transmission failures are unique because they create a specific type of blindness: GTM looks healthy, but GA4 is empty.
This leads to diagnostic dead ends:
- Your team rebuilds GTM repeatedly (doesn’t help)
- You blame GA4 (not the problem)
- You assume low traffic (actually blocked traffic)
Real business consequences:
Case 1: The $300K Attribution Gap
- Client spent $300K on ads over 3 weeks
- Corporate firewall blocked GA4 transmission
- Google Ads optimized to incomplete data
- Wasted 40% of spend on channels that weren’t converting
- All because requests never left the building
Case 2: The 40% Invisible Traffic
- E-commerce site saw 10K visitors/day in GA4
- Actually had 16K (40% blocked by ad blockers)
- Marketing team under-budgeted for server capacity
- Site crashed during Black Friday
- Lost $500K in sales because they planned for reported traffic, not actual traffic
Case 3: The sGTM Money Pit
- Agency charged $15K to implement sGTM
- Configured browser → sGTM perfectly
- Never tested sGTM → Google relay
- Client paid for infrastructure that sent zero data
- Took 2 months to discover nothing was working
Layer 3 problems don’t just affect your analytics—they affect every business decision based on that analytics.
You can’t optimize what you can’t measure. And if transmission is broken, you’re optimizing against phantom data.
Dealing with persistent transmission issues? Our diagnostic service inspects the complete data flow from browser to GA4, identifies where requests are failing, and provides a fix or detailed remediation plan. Learn more about our GTM Transmission Diagnostic.
GTM Setup Services
Emergency GTM recovery and tracking experts. 247+ successful recoveries completed.
Having GTM Tracking Issues?
Get your tracking fixed by the experts. Emergency recovery in 2-4 hours.
Get Emergency GTM Fix - $397