Data Shows in DebugView But Not Reports? Your GA4 Processing Is Broken
Your events appear in GA4 DebugView perfectly, but standard reports show zero data. This is Layer 4 (Processing) failure—where Google's internal systems reject, filter, or withhold your data. Here's what's actually happening.
Quick Navigation
The Most Frustrating GA4 Problem: “It’s Working But It’s Not”
A retail client called me after weeks of troubleshooting. Their entire analytics chain was perfect:
- ✅ GTM container loading (Layer 1)
- ✅ Tags firing correctly (Layer 2)
- ✅ HTTP requests reaching Google with 204 status (Layer 3)
- ✅ Events appearing in GA4 DebugView in real-time
But their standard GA4 reports were empty. Zero revenue. Zero conversions. Zero sessions after 48 hours.
“We can see the data going into GA4,” they said. “Why isn’t it showing up in reports?”
This is Layer 4 failure—and it’s entirely within Google’s control, not yours.
Layer 4 is where Google Analytics processes, filters, and displays the data it received. Problems here are invisible to GTM. Your implementation is correct. Transmission succeeded. But GA4’s internal processing rejected or transformed your data.
The diagnostic took 20 minutes. The fix took 3 days (because it required Google support intervention). The cost: a week without usable conversion data during their biggest sales period of the year.
What Layer 4 (Processing) Actually Covers
Layer 4 begins after Google’s collection servers successfully receive your data.
What happens in Layer 4:
- Data Receipt: Google’s
/g/collectendpoint receives your event - Validation: Event structure is validated against GA4’s schema
- Enrichment: Google adds geolocation, device category, browser info
- Filtering: Internal traffic filters, bot filtering, IP exclusions apply
- Custom Definitions: Custom dimensions/metrics are matched and attached
- Data Thresholding: Privacy thresholds are applied (may hide data)
- Processing Latency: Data moves from real-time to standard reports (24-48 hours)
- Report Generation: Standard reports aggregate processed data
GTM has zero control over Layer 4. All the work happens inside Google’s infrastructure.
But problems in Layer 4 manifest as “missing data” that looks like tracking failures—even though your tracking is working perfectly.
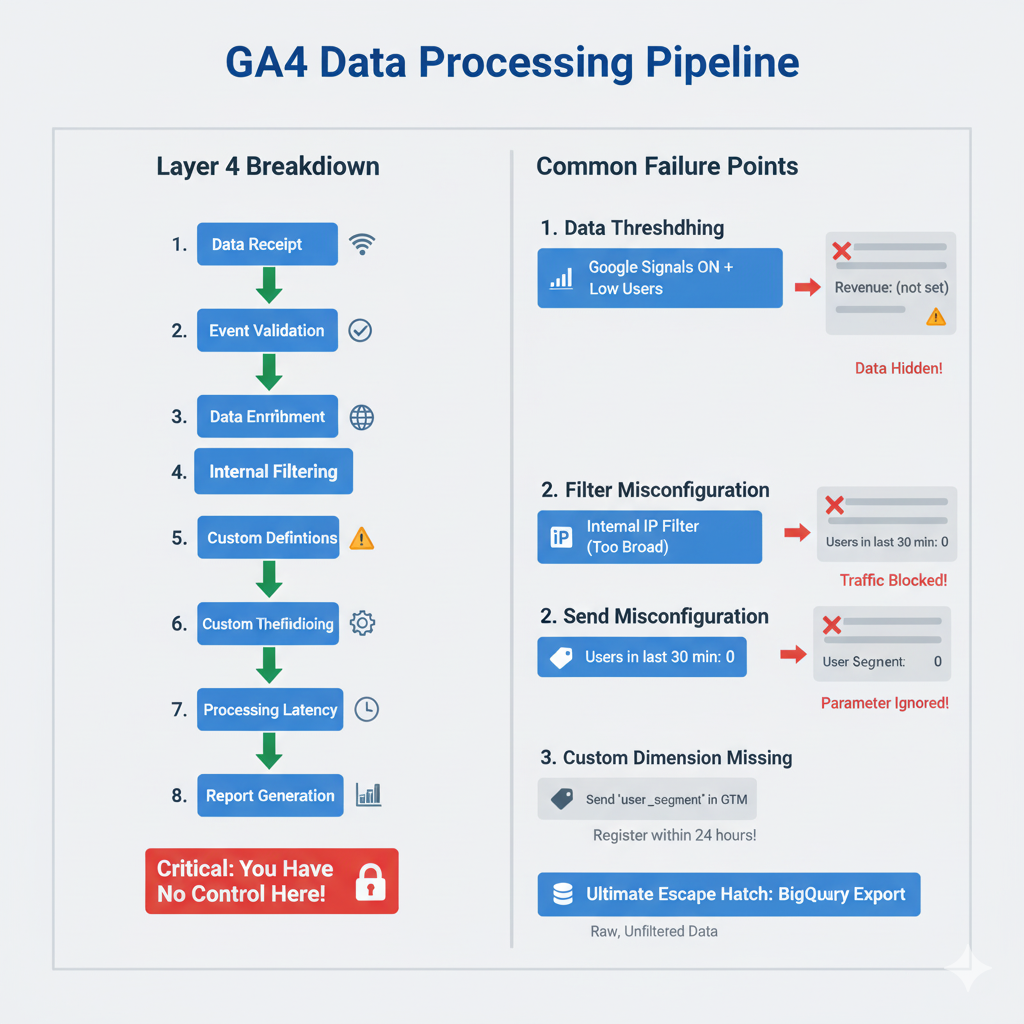
The 8-step GA4 processing pipeline with common failure points. Notice the critical message: “You Have No Control Here!” Once data enters Google’s systems, your ability to troubleshoot is limited to configuration changes and BigQuery exports.
The Layer 4 Diagnostic (Found $500K in “Missing” Revenue)
Step 1: Verify Data Reached Google
Open GA4 → DebugView (under Configure in the left sidebar).
DebugView shows real-time events as they hit Google’s servers.
What you should see:
- Events appearing within seconds of being triggered
- Event names matching your GTM configuration
- Parameters populated with expected values
- User properties attached to events
If data appears in DebugView, Layer 3 (Transmission) succeeded. The data reached Google.
If data doesn’t appear in DebugView:
- Go back to Layer 3 diagnostics
- Check Network tab for failed requests
- Don’t proceed to Layer 4 until DebugView shows events
Step 2: Check Realtime Reports
Open GA4 → Reports → Realtime
Realtime reports show activity from the last 30 minutes, aggregated across all users (not just debug devices).
If events appear here:
- ✅ Data is flowing to standard reporting pipeline
- ✅ No major processing issues
- Problem is likely just processing latency (wait 48 hours)
If events DON’T appear here but DO appear in DebugView:
- ❌ Data is being filtered or rejected during processing
- Check for internal traffic filters
- Check for bot filtering issues
- Look for property-level configuration problems
Step 3: The 48-Hour Wait (The Hardest Part)
GA4 standard reports have 24-48 hour processing latency. This is normal.
The timeline:
- 0-5 seconds: Data appears in DebugView
- 0-30 minutes: Data appears in Realtime reports
- 24-48 hours: Data appears in standard reports (Acquisition, Engagement, Monetization)
If you just deployed tracking:
- Wait 48 hours before panicking
- Check Realtime reports for immediate validation
- Use DebugView for granular event inspection
- Bookmark this checklist and come back in 2 days
If it’s been 48+ hours and standard reports are still empty:
- You have a Layer 4 processing problem
- Proceed to advanced diagnostics below
The Three Most Common Processing Failures
1. Data Thresholding (The Silent Killer)
Symptom: DebugView shows events. Realtime shows users. Standard reports show “(not set)” or missing data. Small orange triangle icon appears in reports.
What’s happening: Google is withholding data to protect user privacy.
How Data Thresholding works:
- GA4 property has Google Signals enabled (cross-device tracking)
- Google detects low user counts in a specific segment
- To prevent user identification, Google hides the data
- You see “(not set)” or missing rows in reports
- The data exists—Google just won’t show it to you
The diagnostic:
Look for this icon in your reports: ⚠️ (orange triangle)
Hover over it. GA4 will say:
“Google Analytics has applied thresholding to one or more cards in this report and will only display the data in the cards when the data meets the minimum aggregation thresholds.”
Translation: You don’t have enough users for Google to feel comfortable showing you the data.
How to check if this is your problem:
- Go to Admin → Data Settings → Data Collection
- Check if “Google Signals” is enabled
- If yes, temporarily disable it
- Wait 24-48 hours
- Check if data appears in reports
Business impact: One client saw “(not set)” for 70% of their revenue in reports. They thought tracking was broken. Actually, they had Google Signals enabled with low traffic. The revenue was there—Google was just hiding it. Disabling Google Signals revealed $500K in “missing” revenue.
The permanent fix:
- Disable Google Signals (lose cross-device tracking)
- OR accept thresholding (live with data gaps)
- OR implement BigQuery export (unthresholded raw data)
There’s no way to keep Google Signals AND avoid thresholding with low traffic.
2. Internal Traffic Filters Catching Production Traffic
Symptom: DebugView shows events. Realtime shows zero users. Standard reports are empty.
What’s happening: GA4 is filtering out your traffic as “internal traffic” (office IPs, developers, etc.).
How GA4 Internal Traffic Filtering works:
- You define IP addresses to exclude (your office, your dev team)
- GA4 tags those events with
traffic_type: internal - By default, reports HIDE internal traffic
- If your filter is too broad, it might catch production users
The diagnostic:
- Go to Admin → Data Settings → Data Filters
- Check if “Internal Traffic” filter is active
- Note which IP ranges are defined
Now check if your production traffic is coming from those IPs:
- Are you filtering an entire IP range that includes customers?
- Are you filtering a cloud provider’s IP block (Cloudflare, AWS) that your site uses?
- Are you filtering “localhost” but your dev and prod share a domain?
To test:
- Temporarily disable the Internal Traffic filter
- Wait 24 hours
- Check if reports populate
Business impact: I’ve seen filters that blocked entire countries (someone fat-fingered an IP range), entire hosting providers (AWS IP block caught production), and all mobile traffic (misconfigured IP v6 filter).
The fix: Review your internal traffic definitions. Use Test Traffic filters instead during development (they don’t affect production data).
3. Missing or Misconfigured Custom Dimensions
Symptom: Events appear in DebugView with parameters. But when you try to view those parameters in standard reports, they show “(not set)”.
What’s happening: You’re sending custom parameters from GTM, but you haven’t registered them as custom dimensions in GA4.
How Custom Dimensions work in GA4:
- GTM sends parameter:
item_category: "Widgets" - GA4 receives event: Parameter is in DebugView
- GA4 checks Custom Definitions: Is
item_categoryregistered?- If yes: Parameter is saved and appears in reports
- If no: Parameter is discarded after 24 hours
You have 24 hours from first send to register a custom dimension. After that, historical data is lost.
The diagnostic:
- Open DebugView
- Click on an event
- Look at the Parameters list
- Note any custom parameters (not standard GA4 parameters)
- Go to Admin → Custom Definitions → Custom Dimensions
- Check if those parameters are registered
If they’re not registered:
- Click “Create Custom Dimension”
- Set the parameter name exactly as it appears in DebugView
- Set scope (Event, User, or Item)
- Save
Critical timing issue: You must register dimensions within 24 hours of first data collection. If you register late, only NEW data will use the dimension. Historical data is gone.
Business impact: A B2B client was sending company_size and industry parameters from their CRM. They appeared in DebugView perfectly. But they never registered them as custom dimensions. Three months of segment data lost—unable to analyze which industries converted best.
The Case Sensitivity Trap That Breaks Everything
Here’s a silent killer that affects Layer 4: GA4 is case-sensitive. GTM is not.
The problem:
- GTM sends:
currency: "usd"(lowercase) - GA4 expects:
currency: "USD"(uppercase) - Result: GA4 rejects the value, reports show $0 revenue
The diagnostic snippet:
(() => {
  if (typeof dataLayer === 'undefined') return 'No dataLayer found';

  const currencyEvents = dataLayer.filter(item =>
    item.currency ||
    (item.ecommerce && item.ecommerce.currency) ||
    (item.event_parameters && item.event_parameters.currency)
  );

  if (currencyEvents.length === 0) return 'No currency events found';

  return currencyEvents.map(event => {
    const currency = event.currency ||
                    (event.ecommerce && event.ecommerce.currency) ||
                    (event.event_parameters && event.event_parameters.currency);

    const isUpperCase = currency === currency.toUpperCase();
    const eventName = event.event || 'unknown';

    return `${eventName}: "${currency}" ${isUpperCase ? '✅ UPPER' : '❌ lower'}`;
  });
})();
Run this in your console. Check every currency value.
If you see:
purchase: "usd" ❌ lower
Your revenue tracking is broken. GA4 is receiving purchase events but rejecting the currency.
The fix:
- Update your dataLayer.push to send
"USD"not"usd" - Update any GTM variables that populate currency
- Ensure all ecommerce parameters follow GA4’s expected case
This also affects:
item_categoryvsitem_Category(GA4 treats as different parameters)user_idvsuserId(only one will map correctly)- Event names:
Purchasevspurchase(creates two separate events)
Business impact: One Shopify client sent lowercase “usd” for three months. GA4 showed 5,000 purchases with $0 total revenue. They thought their store was broken. Actually, currency formatting was broken. Fix took 5 minutes. Lost attribution data unrecoverable.
The BigQuery Escape Hatch
When Layer 4 processing makes your data unusable (thresholding, filtering, sampling), there’s one solution: BigQuery export.
What BigQuery gives you:
- Raw, unprocessed event data
- No thresholding (see all data, regardless of user count)
- No sampling (100% of events)
- Complete parameter visibility (even unregistered dimensions)
- SQL query power (analyze data however you want)
The tradeoff:
- Requires SQL knowledge (or hiring analysts who know SQL)
- Requires BigQuery infrastructure (free tier covers most small businesses)
- Not a replacement for GA4 UI (different use cases)
When to use BigQuery:
| Scenario | Solution |
|---|---|
| Data thresholding hiding revenue | BigQuery (raw data, no thresholding) |
| Need to see all custom parameters | BigQuery (all params exported) |
| Need to join GA4 data with CRM data | BigQuery (SQL joins) |
| Need historical data beyond 14 months | BigQuery (indefinite retention) |
| Just want dashboards and reports | Stay in GA4 UI |
How to enable:
- Go to Admin → BigQuery Links → Link
- Choose daily or streaming export
- Select your BigQuery project
- Wait 24 hours for first export
Example query (show all events with revenue):
SELECT
  event_name,
  user_pseudo_id,
  (SELECT value.int_value FROM UNNEST(event_params) WHERE key = 'ga_session_id') AS session_id,
  (SELECT value.double_value FROM UNNEST(event_params) WHERE key = 'value') AS revenue,
  (SELECT value.string_value FROM UNNEST(event_params) WHERE key = 'currency') AS currency
FROM `your-project.analytics_XXXXX.events_*`
WHERE event_name = 'purchase'
  AND _TABLE_SUFFIX BETWEEN '20250101' AND '20250131'
ORDER BY revenue DESC
This bypasses all GA4 reporting limitations and shows you exactly what Google received.
The “Processing Latency” Reality Check
The most common “Layer 4 problem” isn’t a problem—it’s just impatience.
GA4’s processing timeline:
| Report Type | Latency | What It Shows |
|---|---|---|
| DebugView | <5 seconds | Raw events from debug devices only |
| Realtime | <30 minutes | Aggregated data from all users (last 30 min) |
| Standard Reports | 24-48 hours | Fully processed, filtered, aggregated data |
| Exploration Reports | 24-48 hours | Same as standard, but ad-hoc queries |
If you deployed tracking today:
- ✅ Expect DebugView to work immediately
- ✅ Expect Realtime to work within 30 minutes
- ❌ Don’t expect standard reports to work until tomorrow
The most expensive mistake: Assuming tracking is broken because standard reports are empty 2 hours after deployment. Teams rebuild GTM containers, call agencies, panic—then 48 hours later everything appears perfectly.
The discipline: Wait 48 hours. Use DebugView and Realtime for immediate validation. Don’t make changes to tracking until the processing pipeline completes.
The Layer 4 Diagnostic Checklist
Before you conclude you have a processing problem:
Run this checklist in order:
- ✅ Check DebugView → Do events appear?
- If no: Go back to Layer 3 (Transmission)
- If yes: Continue
- ✅ Check Realtime reports → Do users appear?
- If no: Check data filters (internal traffic, bot filtering)
- If yes: Continue
- ✅ Wait 48 hours → Do standard reports populate?
- If no: Continue diagnostic
- If yes: You’re done (it was just latency)
- ✅ Check for data thresholding → Orange triangle icons in reports?
- If yes: Disable Google Signals OR use BigQuery
- If no: Continue
- ✅ Check custom dimensions → Are parameters registered?
- If no: Register them now (only affects future data)
- If yes: Continue
- ✅ Check case sensitivity → Run currency checker snippet
- If broken: Fix data layer to send uppercase
- If correct: Continue
- ✅ Check conversions marked → Admin → Conversions → Is purchase_complete marked?
- If no: Mark it and wait 24 hours
- If yes: Continue
- ✅ Enable BigQuery → Set up export, query raw data
- If data appears in BigQuery but not UI → processing/filtering issue
- If data doesn’t appear in BigQuery → transmission failed (back to Layer 3)
What This Means for Your Business
Layer 4 problems are the most dangerous because they’re invisible.
You think everything is working:
- GTM Preview Mode shows tags firing ✅
- Network tab shows 204 status ✅
- DebugView shows events ✅
- But reports are empty ❌
This creates false confidence. You deploy to production. You move on to other projects. Meanwhile, your business is operating blind.
Real business consequences:
Case 1: The $500K Thresholding Blind Spot
- Retail client saw “(not set)” for 70% of revenue
- Assumed tracking was broken
- Spent 3 weeks rebuilding GTM
- Problem was Google Signals thresholding
- $500K in revenue was always there—just hidden
Case 2: The Lowercase Currency Disaster
- E-commerce site sent “usd” (lowercase) for 4 months
- GA4 showed 10,000 purchases, $0 revenue
- Google Ads optimized to transaction count, not value
- Spent $100K on low-value orders
- Fix took 5 minutes, lost attribution data unrecoverable
Case 3: The Missing Custom Dimension
- B2B SaaS tracked
plan_typeparameter perfectly - Appeared in DebugView for 6 months
- Never registered as custom dimension
- Unable to analyze which plans converted
- Lost 6 months of product intelligence
Layer 4 problems don’t break your site. They break your business intelligence—slowly, silently, and expensively.
That’s why this diagnostic matters. The data might be flowing perfectly through Layers 1-3. But if Layer 4 rejects it, you’re optimizing blind.
Need help diagnosing GA4 processing issues? Our diagnostic service reviews your complete data pipeline from GTM to GA4 reports, identifies where data is being filtered or rejected, and provides a detailed remediation plan with expected data recovery timeline. Learn more about our GA4 Processing Diagnostic.
GTM Setup Services
Emergency GTM recovery and tracking experts. 247+ successful recoveries completed.
Having GTM Tracking Issues?
Get your tracking fixed by the experts. Emergency recovery in 2-4 hours.
Get Emergency GTM Fix - $397